Desktop app · works offline

From 3D stage to pack list.
In one app.

LED Event Manager is a tool for designing LED installations for events. Lay out screens in 2D and 3D, build pixel maps, route signal and power, draw the connection diagram — then export the full set of documents or send a live image over NDI.

Design LED screens for concerts.

  • No account or login
  • 100% offline
  • Projects stay on your disk
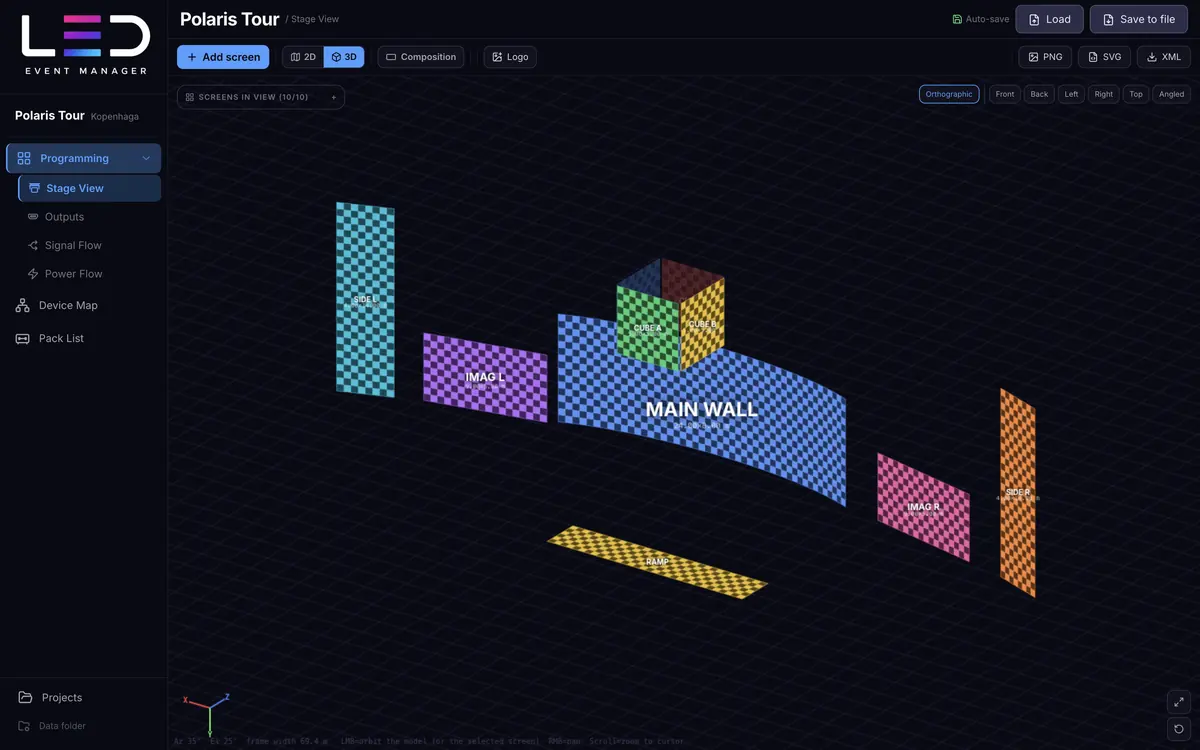
LED Event Manager — Polaris Tour · Stage View 3D
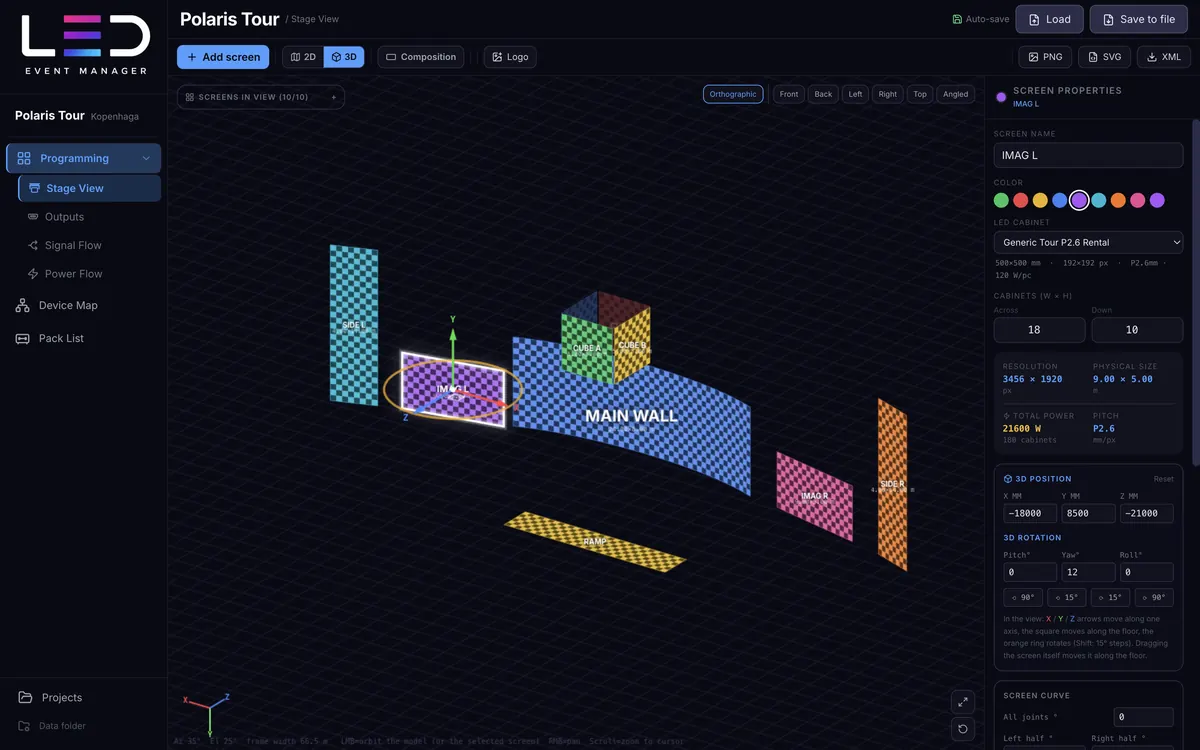
3D view in LED Event Manager: a curved main wall, IMAG screens, side hangs, an LED cube above the stage and a ramp.
112 signal outputsSignal Flow · 50 Hz
333.6 kW114 circuits · Power Flow
2168 cabinets10 screens · 3 module types
Why

One source of truth instead of five files.

A pixel map in a graphics program, a pack list in a spreadsheet, a diagram in a separate drawing, calculations in a calculator — every screen change means edits in several places at once. Here everything comes from one project.

The usual way

  • Pixel maps drawn by hand, separately for each output
  • Output count and port load worked out in a calculator
  • Watts and circuits listed in a spreadsheet
  • Pack list retyped from the diagram
  • After every screen change — edits in several files

In LED Event Manager

  • Set a screen once — cabinets, resolution, dimensions and power calculate themselves
  • The load on every output and circuit is visible live, with a warning near the limit
  • The pack list builds itself from the diagram, screens and signal flows
  • One project in one file: auto-save, backup copy, moving to another computer

Change a screen — the cabinet count, power and pack list are up to date instantly.

Projects

Seven projects, seven different layouts.

This is not just one wall on a stage. In the app you open tours, conferences, XR studios and trade-fair booths with ceilings, floors and angled screens. The cabinets, signal outputs and power on the cards come from the app's Dashboard, and screens are counted physically (a screen cut across several outputs is one screen). You can open every project in the modules below.

Concert tour · arena

Polaris Tour

Main wall 24 × 8 m in an arc, cut across two outputs. Two IMAG screens, side hangs, an LED cube above the stage and a ramp made of floor tiles. Output backups on the processor's free outputs.

  • 10screens
  • 2168cabinets
  • 112outputs
  • 333.6kW
  • Screen cut across 2 outputs
  • Curve approx. 41°
  • Cube of 4 screens
  • Ramp of floor tiles
  • Output backups
Real project · Berlin

Nova Reveal

Eight 50 Hz outputs with backups: MAIN walls cut across outputs, a cube made of walls and a ceiling, a center screen and transparent screens on a separate output. A project by the app's author.

  • 12screens
  • 895cabinets
  • 78outputs
  • 77.9kW
  • 8 outputs · 50 Hz
  • Screens cut across outputs
  • Output backups
  • Custom cabinets
  • 2D stage
Festival · main stage

Neon Pulse

A 10 × 5 m wall in a 40° arc, two vertical IMAG screens and the DJ booth front on two 60 Hz outputs. Screens hung in 3D at different heights.

  • 4screens
  • 364cabinets
  • 26outputs
  • 40.8kW
  • Curve 40°
  • Vertical IMAG screens
  • Output backup
  • 60 Hz
Corporate conference

Tech Summit

A 22.5 × 3 m panorama (P1.9) in an arc across three outputs, a speaker's lectern, confidence screens for presenters, portals beside the stage and four totems in the foyer.

  • 11screens
  • 690cabinets
  • 92outputs
  • 80.0kW
  • Fine pitch P1.9
  • Screen across 3 outputs
  • Curve 33°
  • Confidence screens
  • Foyer totems
XR studio · LED volume

XR Studio

A curved 18 × 4 m backdrop (147° angle), two angled wings, a ceiling and a floor. Everything runs at 60 Hz, and the floor tiles draw more power than the backdrop panels.

  • 5screens
  • 672cabinets
  • 74outputs
  • 97.3kW
  • 147° backdrop
  • Ceiling and floor
  • Wings angled at 50°
  • 60 Hz
  • 250 W tiles
Trade-fair booth · vehicle launch

MotoExpo

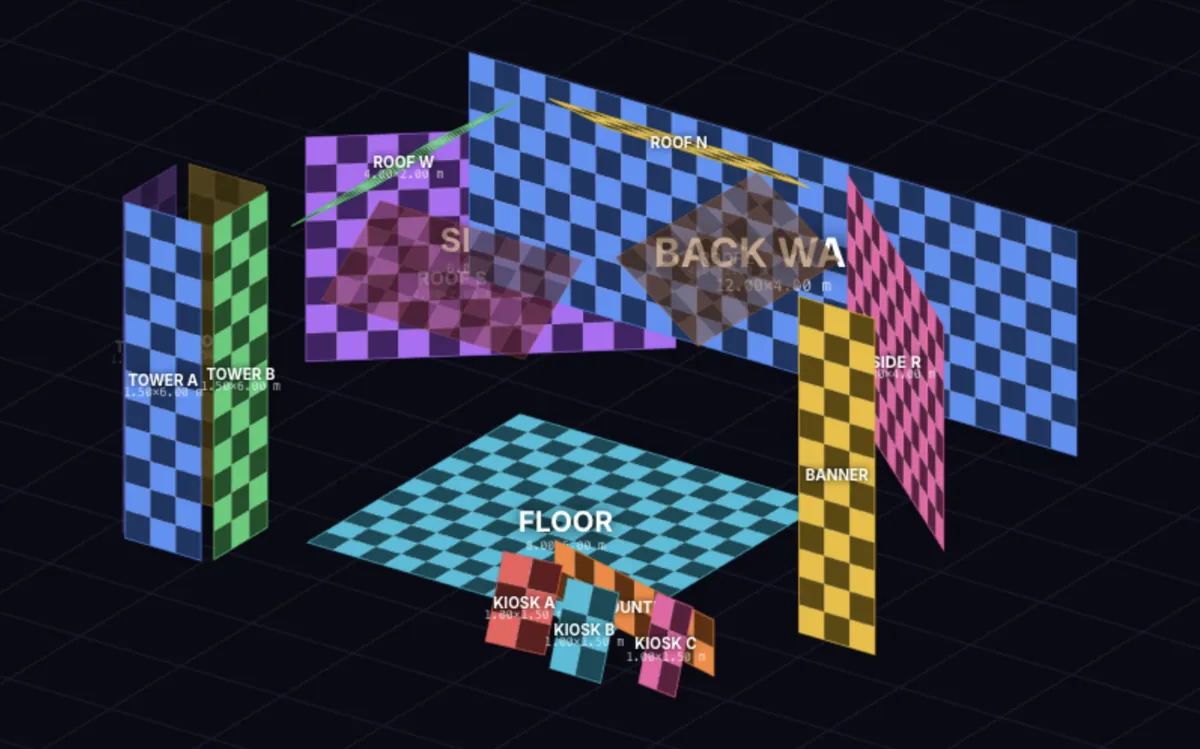
A 12 × 12 m island booth: a back wall, two angled side walls, a pitched “roof” of four screens, an LED floor, a four-sided tower, a counter, kiosks and a vertical banner.

  • 17screens
  • 870cabinets
  • 43outputs
  • 94.1kW
  • Roof pitched at 35°
  • LED floor
  • Four-sided tower
  • Banner rotated 90°
  • Angled kiosks
Trade-fair booth · island

TechFair

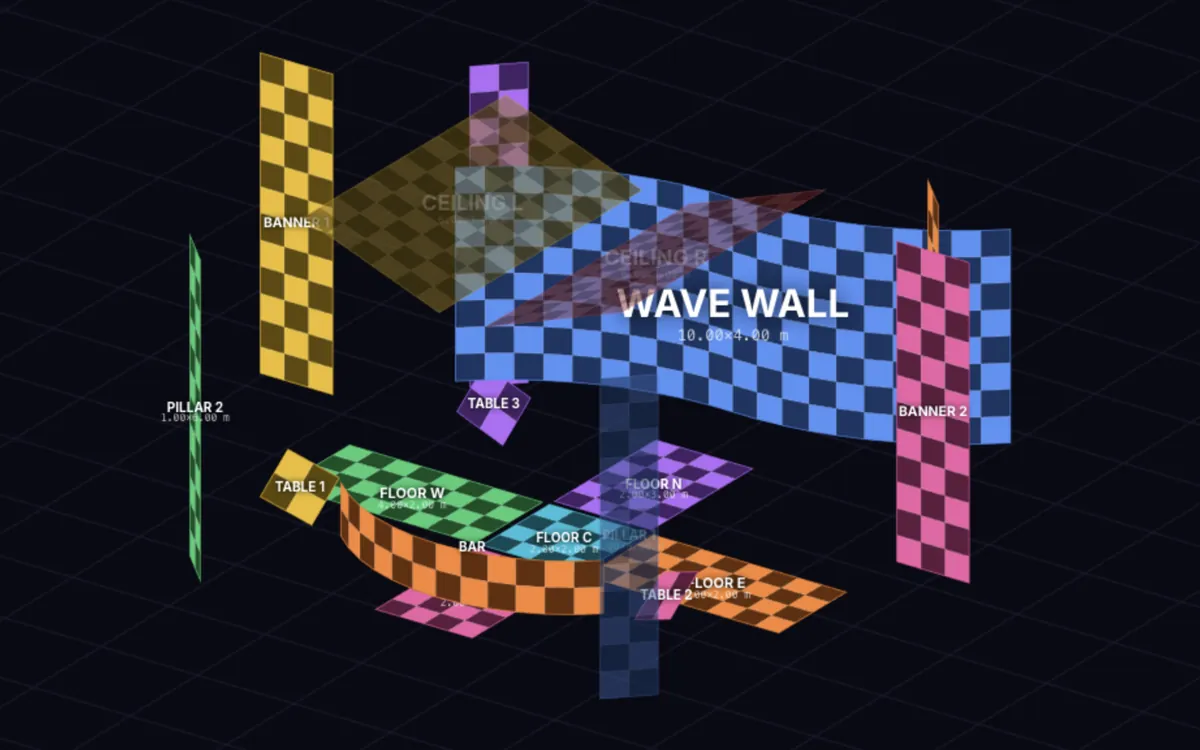
A booth open on every side: a back wall laid out as a wave, a V-shaped ceiling, a cross-shaped floor, angled interactive tables, four pillars and a convex counter.

  • 18screens
  • 636cabinets
  • 60outputs
  • 76.5kW
  • Wave wall
  • V ceiling
  • Cross-shaped floor
  • Angled tables
  • Convex counter

Six projects are examples: the layouts and numbers were made up for this presentation. “Nova Reveal” is a layout from the app author's real project, shown under a made-up name.

3D view

Grab the stage and rotate it.

These are frames from the app's real 3D view. Drag to see the stage from every side, or pick another project. In the app you rotate it the same way, and you position screens in space to the millimeter.

Polaris Tour · Stage View 3D

In the app you rotate the view by dragging the mouse, around the center of the model or the selected screen.

Modules

Seven views. Your project.

Every stage of the work has its own module, and they all read the same data. Pick a demo project and switch views to see the real interface on different projects: from a concert tour to a booth with a ceiling and an LED floor. All screenshots come from the app.

Project

Polaris TourConcert tour · arena10 screens2168 cabinets112 signal outputs333.6 kW

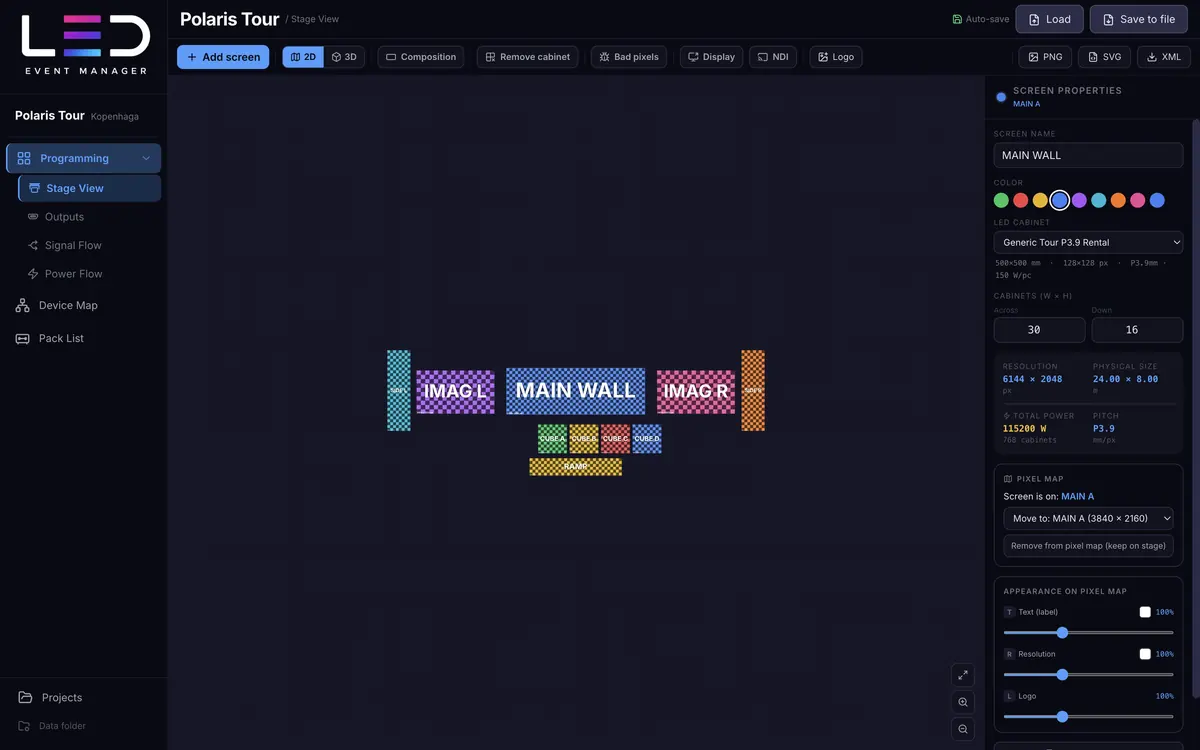
Polaris Tour · Stage View · 2D
Stage View: LED screens laid out on a virtual stage, with the selected screen's properties panel on the right showing resolution, physical size and power. Project: Polaris Tour. Enlarge

2D and 3D stage

Lay out screens on the virtual stage the way they stand on site — then switch to 3D and check how they look from every side.

  • Custom LED cabinets. You define the size in mm, resolution, pitch and power per piece, and a saved cabinet comes back for the next screens. You can duplicate or delete a screen with one button, together with its pieces cut across outputs.
  • 3D view in parallel projection (the default, with no perspective distortion) or in perspective, with ready-made Front, Back, Left, Right, Top and Angled views.
  • Position and rotation on three axes (pitch, yaw, roll) — dragged with the handle on screen or typed in the panel — plus screen curve: an angle at every cabinet joint, shared or individual.
  • Cabinets under control: removing individual modules (with the option to restore them) and a Bad pixels mode for marking module quarters.
  • Composition — the stage work area that becomes a single frame in PNG export and in NDI.
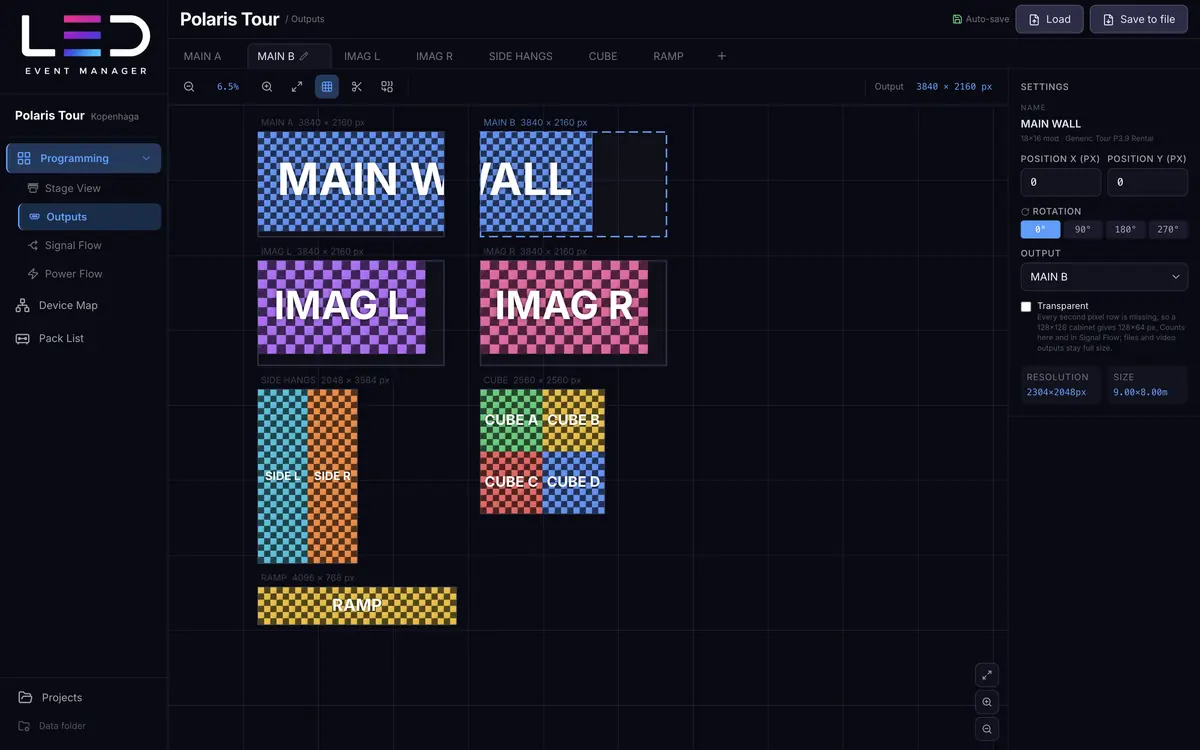
Polaris Tour · Outputs
Outputs module: pixel maps of the screens assigned to the processor outputs, with the selected screen's settings on the right, including the Transparent switch. Project: Polaris Tour. Enlarge

Pixel maps for the processor

Every processor output is a separate canvas with its own resolution. Assign screens to it and you have a ready pixel map — with everything the crew needs on site.

  • Any number of outputs — ready-made sizes 1920×1080, 3840×1080, 3840×2160, 7680×1080 and 7680×2160, or a custom one. You switch between them with tabs and reorder them by dragging.
  • Cabinet numbering, name and resolution on the screen — like a real control map. Rotation 0°, 90°, 180° and 270°.
  • Cutting and merging screens. Cut a screen across outputs and the cabinet numbering stays continuous.
  • Project logo and texts on screens: you set the name and resolution scale and color, as well as the logo scale, per screen in the “Appearance on pixel map” panel in Stage View.
  • Transparent screen — the “Transparent” checkbox counts only every second pixel row: a 128×128 cabinet gives 128×64 px. The pixel map and Signal Flow count it realistically, so a port can carry twice as many such cabinets, while files and video outputs stay at full resolution.
  • Unassigned screens from Stage View wait in a bar — you assign them to an output with one click.
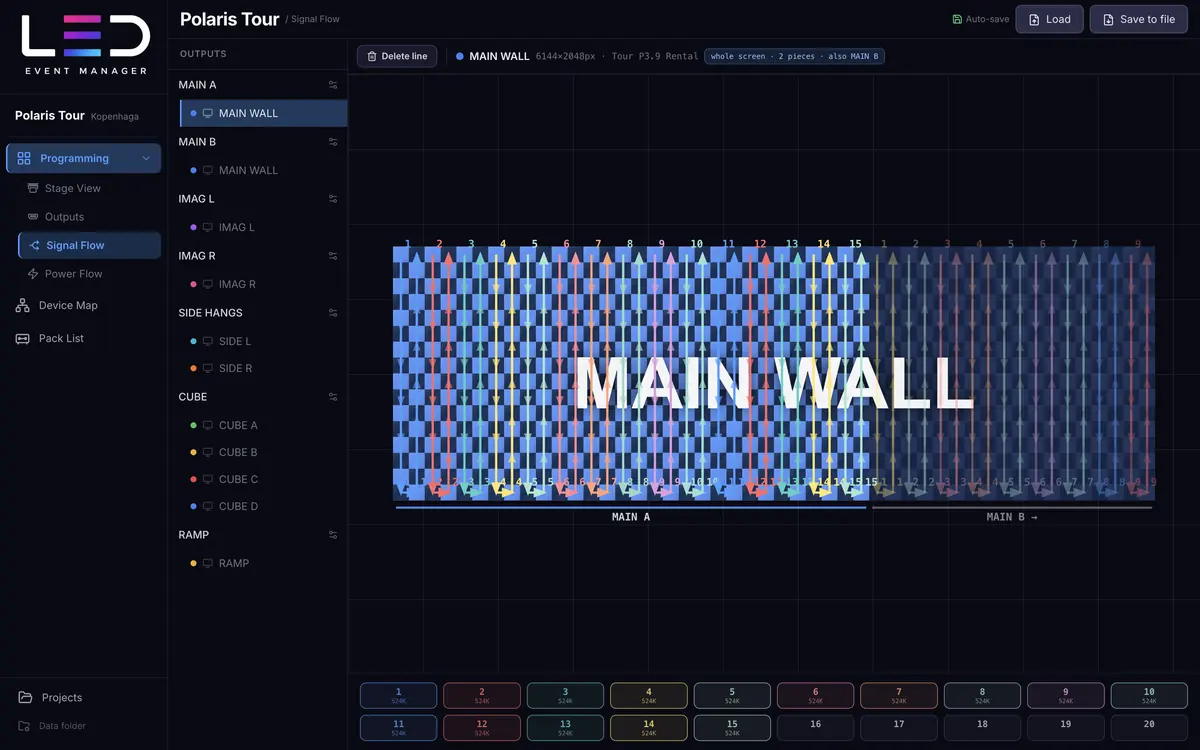
Polaris Tour · Signal Flow
Signal Flow: a screen cut across two processors drawn as a whole, with colored lines along the cabinets (a separate color for each output), a dimmed piece fed by the other output and output buttons showing load. Project: Polaris Tour. Enlarge

Signal and output limits

Select an output and draw a line along the cabinets — the app keeps counting how many pixels each processor port carries.

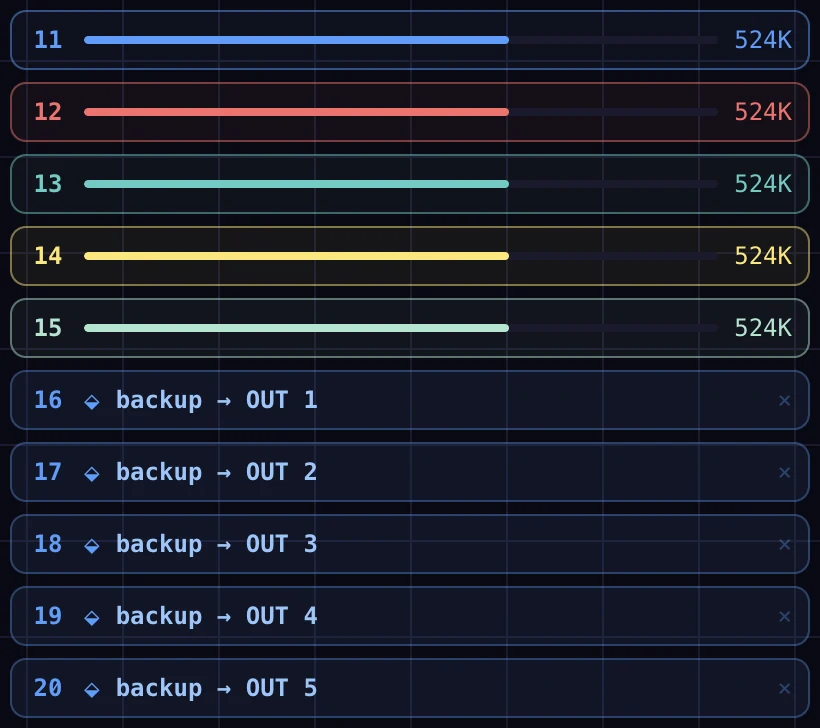
Close-up: the second column of processor outputs with the load of each output. Project: Polaris Tour.
Processor output load against the pixel limit. You set a free output as a backup of a busy one.
  • 50 or 60 Hz and 4, 6, 10, 16 or 20 processor outputs.
  • Pixel limit per output (650K at 60 Hz, about 786K at 50 Hz): the bar turns yellow above 80% and warns when exceeded.
  • Output backups — drag an empty output onto an active one to create a backup path, shown in the list as “backup → OUT 5”.
  • Backup controller on a separate device: one button creates a mirror of all the cabling, and the Pack List adds a separate row of cables.
  • Signal preview on the whole screen. A screen cut across several outputs is shown whole: you draw the part fed by the selected output, and the other pieces are dimmed, with a line and the processor name under the screen. Every output has its own line color, and PNG export stitches the pieces into one screen that you send to the crew.
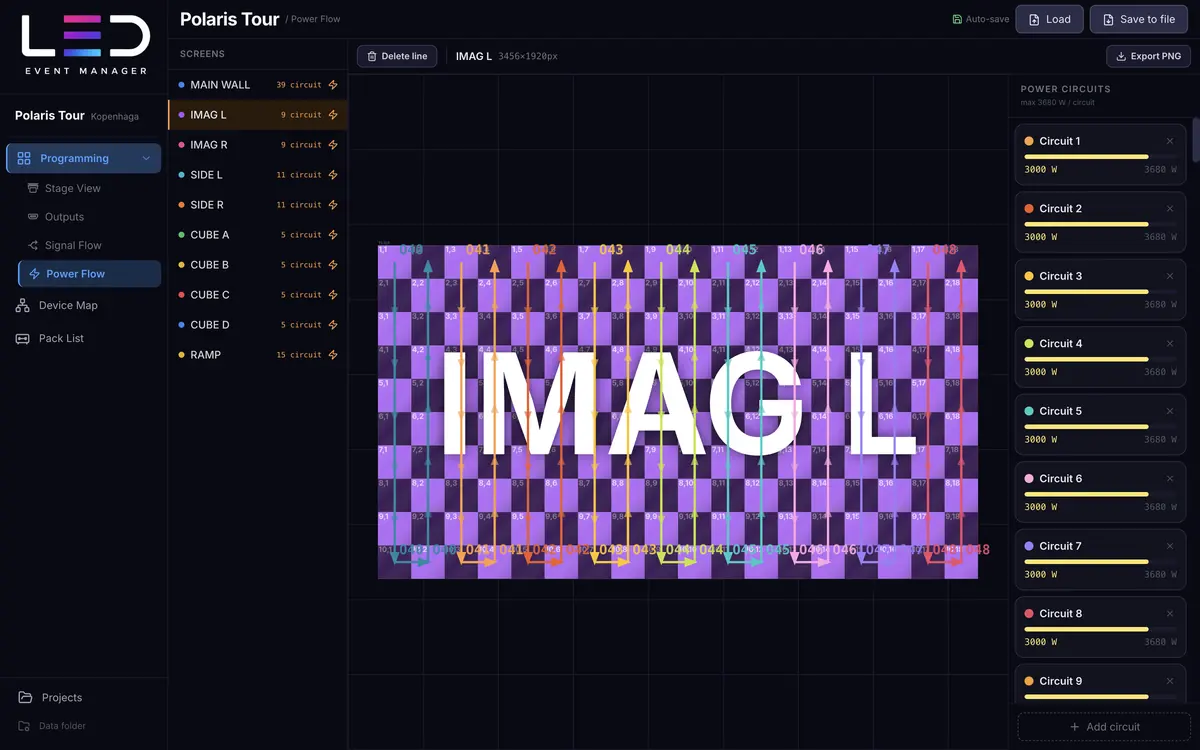
Polaris Tour · Power Flow
Power Flow: a list of screens, colored power circuit paths on the pixel map and a list of circuits with their load against the 3680 W limit. Project: Polaris Tour. Enlarge

Power circuits

You pick a screen and draw circuits along the cabinets, and the watts add up on their own. Power is counted on whole screens, as they stand in Stage View, so splitting across outputs never gets in the way.

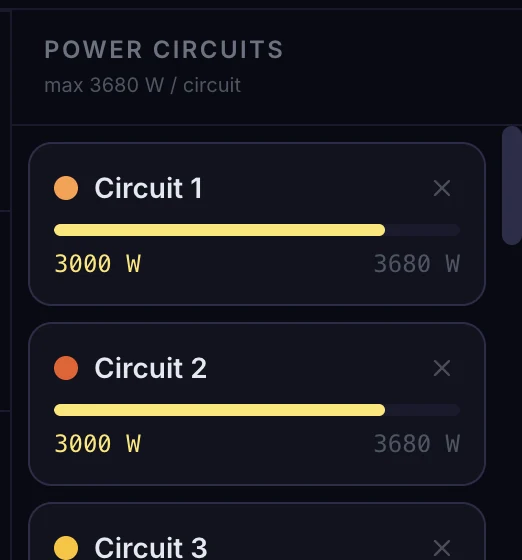
Close-up: the list of power circuits with load bars against the 3680 W limit. Project: Polaris Tour.
Each circuit has a load bar against the 3680 W limit.
  • 3680 W circuit limit (16 A · 230 V). Every circuit has a load bar and a warning as it nears the limit.
  • Power from the cabinet definition. A custom module has its own power per piece, and the app counts only the cabinets the circuit passes through. Removed cabinets are not counted in the power.
  • Circuits shared across the project. You pick screens from the list on the left, and the same circuit can power cabinets from several screens. Each has its own color and number on the pixel map.
  • Totals flow on — to the dashboard, the PDF report and the pack list (power cables, one per circuit). You can export each screen's power to PNG.
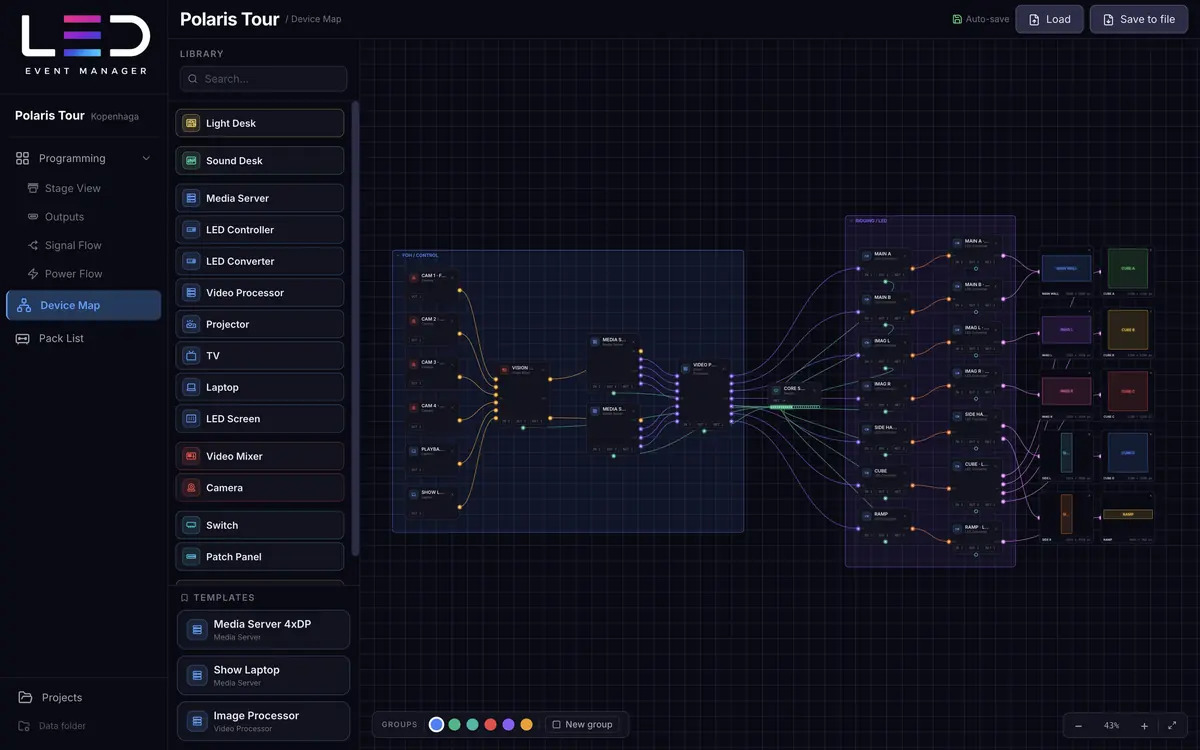
Polaris Tour · Device Map
Device Map: a connection diagram from video sources through the mixer, media servers and LED controllers to the LED screens. Project: Polaris Tour. Enlarge

Connection diagram

Draw the signal chain from source to screen: media server, mixer, processors, switches, cameras and LED screens. Instead of a separate drawing you get a diagram that feeds the pack list.

  • A library of 15 device types (media server, LED controller, mixer, switch, camera, laptop, projector, desks and more) plus custom devices.
  • Typed ports and cable colors: HDMI, DisplayPort, SDI, fiber, LED, Thunderbolt, audio, network, plus HDMI and SDI loops.
  • Cable lengths, IP addresses, groups (e.g. FOH) and saved device templates.
  • LED screens in the diagram show a preview of their own pixel map and the resolution.
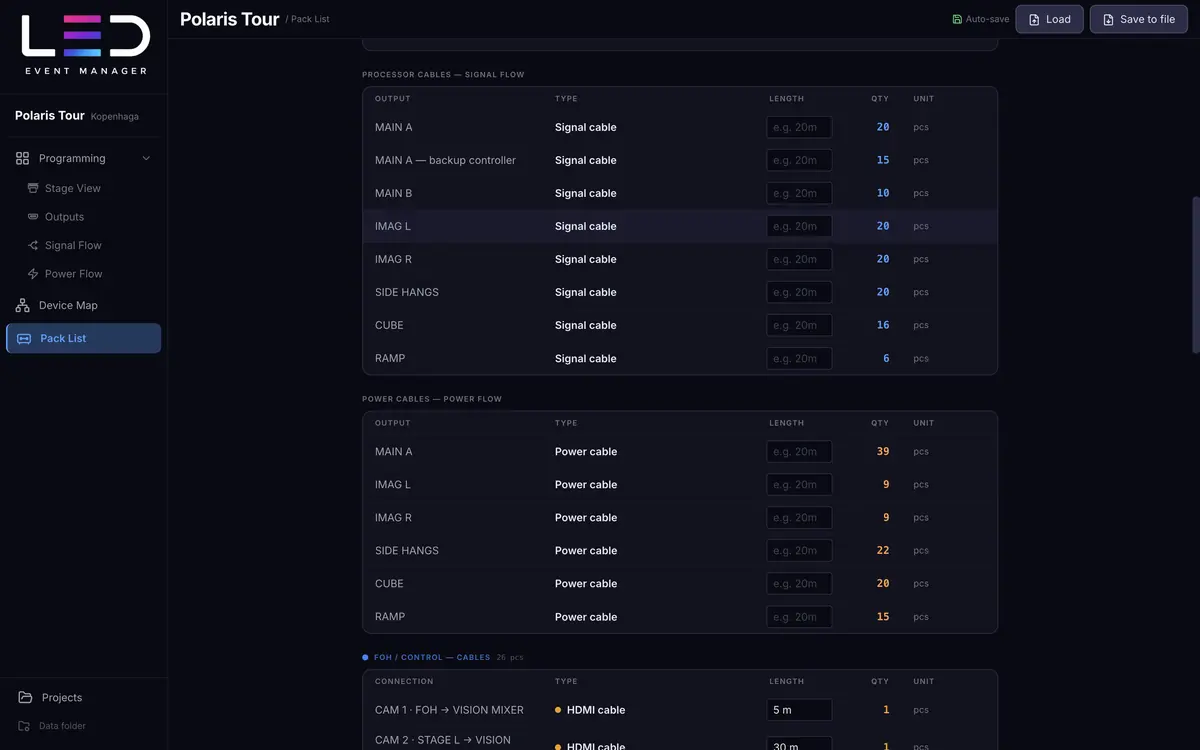
Polaris Tour · Pack List
Pack List: processor cables from Signal Flow (with a separate row for the backup controller), power cables from Power Flow and cables from the connection diagram. Project: Polaris Tour. Enlarge

Pack list from the project

The equipment list builds itself from the diagram, screens and signal flows. You only add the small items.

  • AV devices grouped by category, with quantities.
  • LED cabinets with power and signal cables added per piece.
  • Processor and power cables — one for each output in use (Signal Flow) and each circuit (Power Flow), separately for every output. The backup controller gets its own row of signal cables.
  • Cables from the diagram grouped by group (e.g. FOH), with lengths. You add your own items (tape, weights, ramps, distribution boxes) by hand, and export the whole thing to PDF.
Polaris Tour · Dashboard
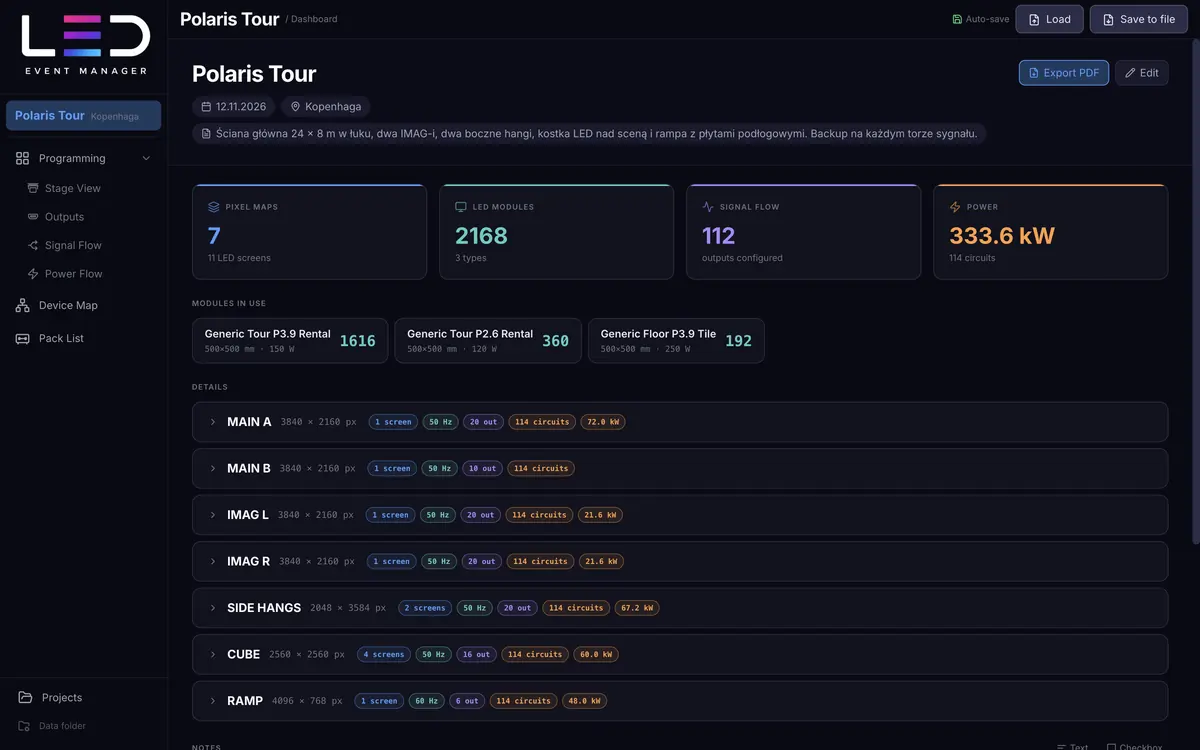
Event dashboard: stat cards, the modules in use, output details and notes. Project: Polaris Tour. Enlarge

Summary and report

One page with the numbers of the whole event: how many maps, cabinets, signal outputs and kilowatts. Press ⌘D and it's right in front of you.

  • Stat cards: pixel maps, LED modules, configured signal outputs, total power and the number of circuits.
  • Details of every output: resolution, Hz, outputs, circuits and kilowatts — expanded with one click.
  • Notes and checklists for the project — draggable, with tick boxes.
  • PDF report (“Technical report”) with the date, venue and description of the event — to send to the client or the crew.
3D view

Grab an arrow and move the screen through space.

A selected screen gets a handle in the 3D view: three axis arrows, a square for sliding along the floor and an orange ring for rotation. A plain click moves nothing — you move only what you grab, and the position rounds to 10 mm. You can enter the same values in the screen panel.

Polaris Tour · Stage View 3D · selected screen IMAG L
3D view with the IMAG L screen selected: red, green and blue axis arrows, a square on the floor and an orange rotation ring, with a panel of positions in millimeters next to it. Enlarge
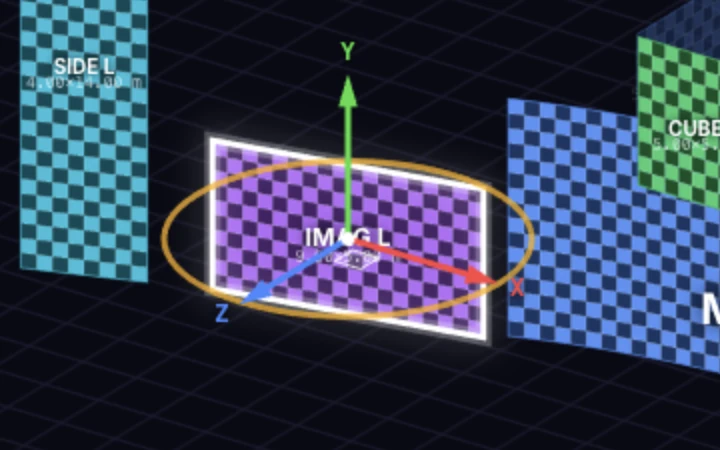
Close-up of the screen handle: a green Y-axis arrow, a red X-axis arrow, a blue Z-axis arrow, a square on the floor and an orange rotation ring.

The inset shows a close-up of the handle: X (red), Y (green) and Z (blue) arrows, the square on the floor and the rotation ring. The panel on the right shows position and rotation.

X, Y and Z arrows

Each arrow moves the screen along its own axis only. The green one changes the hanging height while the floor position stays. The bar at the bottom of the view shows the value in millimeters and the difference from the start.

Square on the floor

Moves the screen across the floor plane, keeping its height. Dragging the screen itself does the same; when you look at the stage almost horizontally, the screen slides along the wall facing you.

Rotation ring

Rotates the screen around the vertical axis (yaw). With the Shift key rotation jumps in 15° steps, without it rotation goes in 1° steps. The ⟲ and ⟳ buttons in the panel make 90° and 15° steps.

Numeric panel

X, Y, Z position in millimeters plus pitch, yaw and roll in degrees. You drag the handle or type a value — both ways change the same thing. The Reset button returns to the 2D layout.

The background rotates the view

Dragging the background rotates the stage around the center of the model or the selected screen, the right button pans the view, and the wheel zooms toward the point under the cursor.

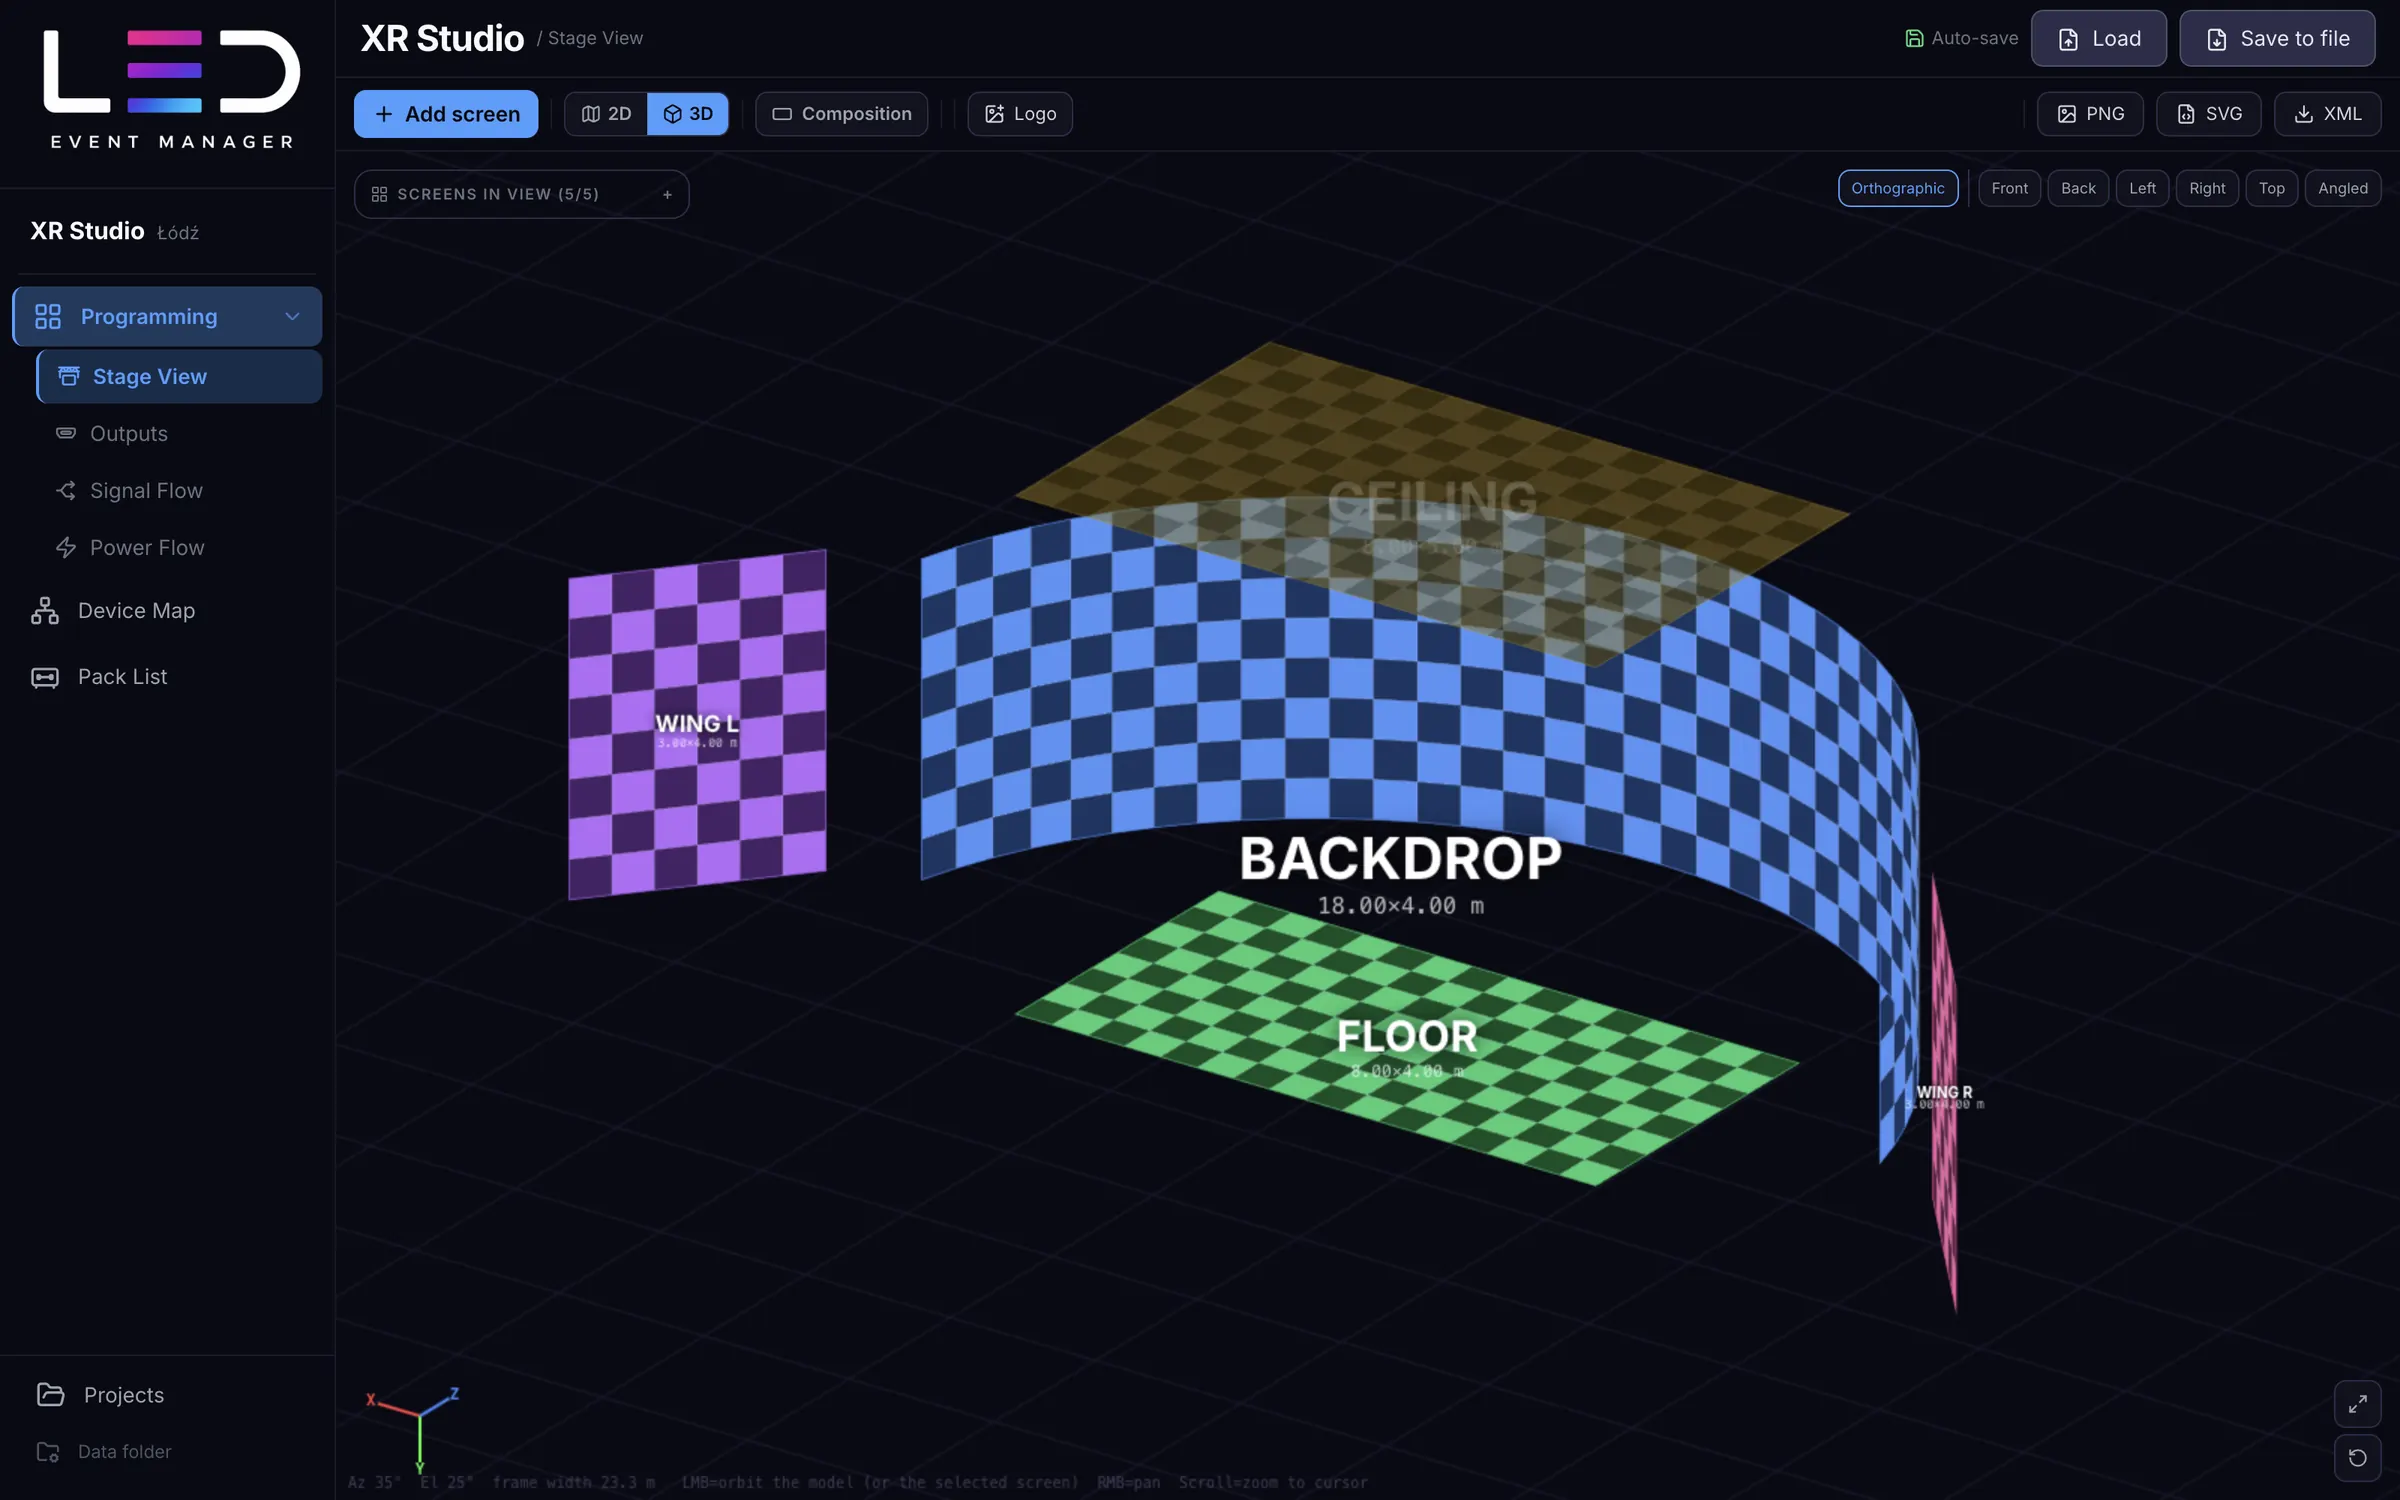
XR Studio · Stage View 3D · 147° backdrop
3D view of the XR studio: a strongly curved 147-degree backdrop, two wings, a ceiling and a floor. Enlarge
3D view

A screen curved in 3D. The pixel map stays flat.

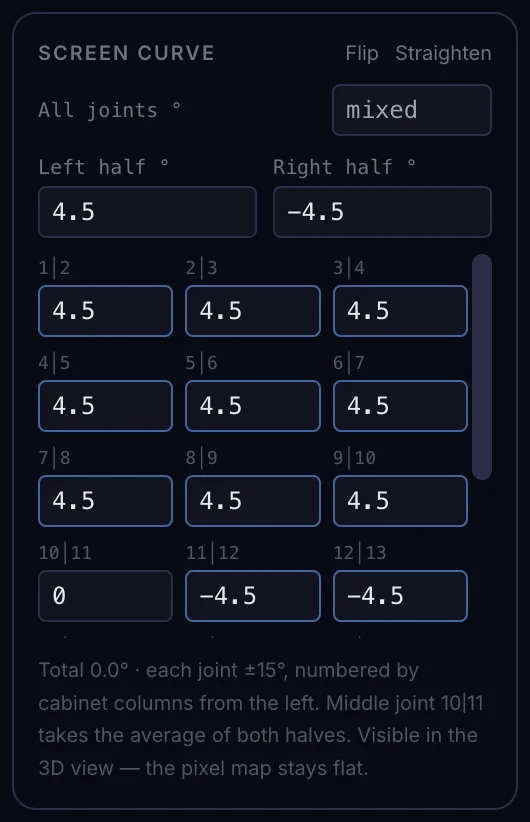
Every cabinet is flat, and the screen bends only at the joints between columns. You set one angle for the whole screen, separate ones for the left and right halves (that makes an S-bend) or one for each joint (up to ±15°), so you get a stage arc, a wave or a convex counter, all the way to the 147° backdrop in the XR studio. The processor still gets an ordinary, flat map.

  • Parallel projection or perspective — with one button.
  • Rotation around the center of the model or the selected screen; the pivot never runs away.
  • You choose which screens appear in the 3D view — with a dozen or so screens the model stays readable.
  • Position in millimeters (X, Y, Z) and pitch, yaw and roll angles you enter in the panel or drag with the arrows on screen.
  • Curving with one click: “Flip” reverses the direction of the arc and “Straighten” flattens the screen again.
Close-up: the Screen curve section of the screen panel, with fields for the left and right halves and the angle of each joint separately (positive and negative values).
The halves of the screen and each joint separately: here an S-bend on the TechFair booth.
Booths and interiors

Ceilings, floors and walls at any angle.

At trade fairs, screens hang overhead, lie underfoot and stand at unusual angles. Every screen has a position in millimeters and a rotation on three axes, and its pixel map for the processor always stays flat and rectangular.

MotoExpo · Stage View 3D
3D view of the MotoExpo booth: a back wall, angled side walls, a pitched roof made of four screens, a floor, a tower, a counter and kiosks. Enlarge

Island booth with a vehicle launch

A back wall and two angled side walls, a “roof” of four screens tilted over the vehicle, an LED floor beneath it, a tower visible from four sides, a counter, kiosks and a vertical banner.

  • 17 screens
  • Roof pitched at 35°
  • LED floor
  • Four-sided tower
  • Banner rotated 90°
TechFair · Stage View 3D
3D view of the TechFair booth: a wave-shaped wall, a V ceiling, a cross-shaped floor, angled tables, pillars and a convex counter. Enlarge

A booth open on every side

A back wall laid out as a wave from joint angles, a V-shaped ceiling, a cross-shaped floor, angled interactive tables, four pillars, two vertical banners and a convex counter. The same project in 2D is four independent pixel maps.

  • 18 screens
  • Wave wall
  • V ceiling
  • Cross-shaped floor
  • Angled tables

Ceiling and roof

You hang a screen over the stage and tilt it to any angle. In MotoExpo four screens make a roof over the vehicle.

LED floor

Tiles lie flat and have their own power per cabinet. The floor counts in circuits and in the pack list like any other screen.

Rotation on three axes

Pitch, yaw and roll set the screen at an angle. Roll 90° turns a horizontal screen into a vertical banner.

One pixel map

However a screen hangs in space, the map for the processor stays flat. A change in 3D doesn't touch the signal.

Live

The same image — over NDI or straight to a monitor.

The pixel map doesn't end at a file. From Stage View you can send it to the network as an NDI source or push it out to a connected monitor — at rehearsal, without exporting and dragging files around.

NDI output

In the screen panel you choose an output and broadcast it to the network. The frame has the resolution of the output, and the pixel map sits in it exactly where it does in the Outputs tab. Mode “Whole output” or “This screen only”.

COMPUTER-NAME (Project — Output)

Monitor output

Send an output to a connected monitor — e.g. straight to an LED processor. “Fit to display” scales while keeping proportions, and “1:1 pixel for pixel” lets you check the sharpness of the mapping. You turn it off with the button or the Esc key.

Bad pixels in the stream

Marked cabinet quarters are visible in NDI and on the monitor too. The crew sees right away which modules to check — no need to describe them in a chat.

NDI requires the NDI Runtime to be installed (it comes with NDI Tools). When it's missing, the NDI section says exactly what it is looking for. The rest of the app works without it.

Exports

Ready-made files for the whole crew — in one click.

Every export opens the system's save dialog. You save a full set of screens at once, asked for the folder only once.

PNG

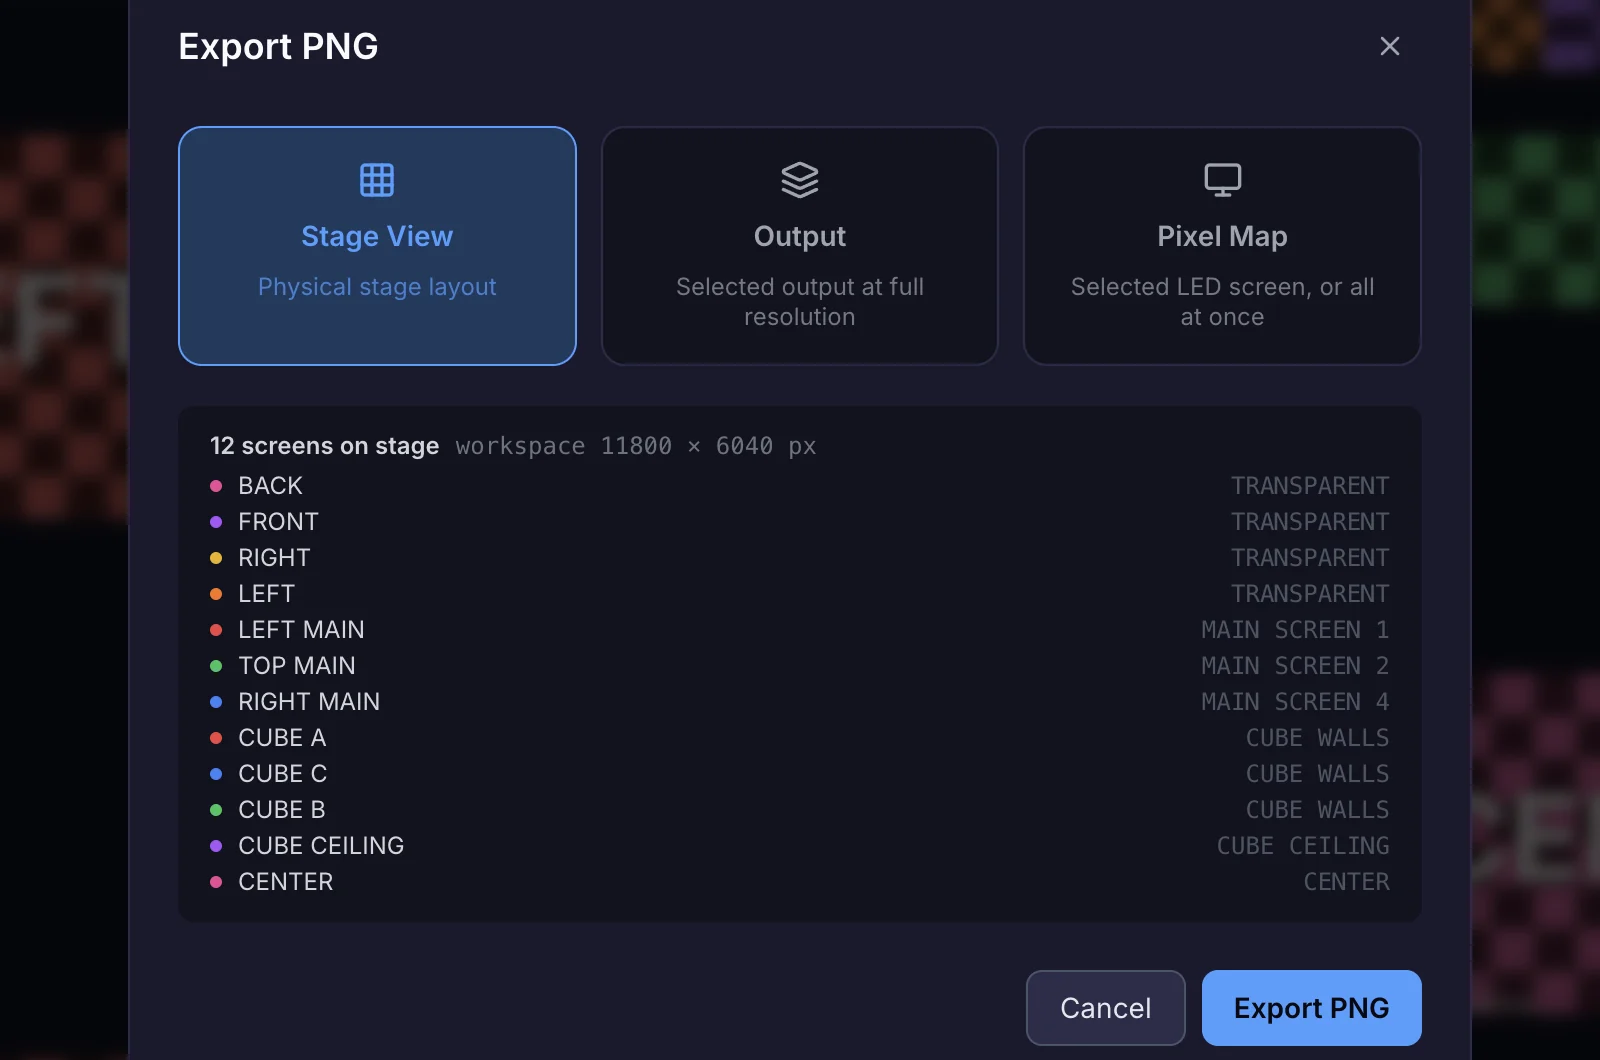
Stage View, a whole output at full resolution or a single screen's pixel map. A full set saves to one folder.

SVG

Pixel maps as vectors — a separate file for each output, ready for further work in a graphics program.

PDF

The pack list and the “Technical report” — an event summary with screens, circuits, signal outputs and notes.

XML for Resolume Arena

Ready-made slices with the chosen input and output, to load in Advanced Output — no manual mapping.

Signal and power diagrams

Signal Flow (a whole output or a whole screen, including one cut across several outputs) and Power Flow (per screen) to PNG, with output and circuit numbers on the pixel map.

Project file

The whole project in one file: you save with ⌘S, and load on another computer with ⇧⌘O.

The PNG export window in the app: three modes — Stage View, Output and Pixel Map.
How it works

From an empty project to a full set of documents in five steps.

  1. Create a project

    Event name, date and venue. You can have as many projects as you like and duplicate them.

    Projects · ⌘N
  2. Set up the stage

    Add screens and lay them out in 2D; in 3D, position them by dragging the axis arrows or typing the position in millimeters.

    Stage View
  3. Make pixel maps

    Assign screens to outputs, cut them where needed and check the cabinet numbering.

    Outputs
  4. Route signal and power

    Draw paths along the cabinets and watch the output and circuit limits before you arrive at the venue.

    Signal · Power Flow
  5. Wrap up the documentation

    Connection diagram, pack list, PDF report, exports — and NDI or a monitor at rehearsal.

    Device Map · Pack List
Try it

Size up a wall in 10 seconds.

This is the calculation Signal Flow and Power Flow do in the app — here in a short version. Pick a cabinet, enter the wall size and see how many processor outputs and power circuits you need.

Refresh rate

Limits as in the app: 650,000 px per output at 60 Hz, 786,432 px at 50 Hz and 3680 W per circuit. The result is approximate — in the app you lay out cabinets exactly along the paths.

Split into outputs

Resolution
Dimensions
Cabinets
Pixels
Total power
Minimum processor outputs
Minimum power circuits

Route the signal yourself

Click the cabinets in order, the way you draw a path in Signal Flow. The bar shows how many pixels a single processor output carries.

Output 10 px
Cabinets: 0Limit: 650 000 px

Covered: 0 / 72
Privacy

Your projects stay on your computer.

No accounts, no cloud, no data sent anywhere. A client's project stays where you made it — and the app works the same in the office as at a venue with no signal.

Works without the internet

No login, no account and no network connection. There's nothing to switch on or sign up for — you launch it and design.

Auto-save to a plain file

The project saves after every change, and the previous version goes to a backup copy. You open the folder from the File → Show Data Folder menu or with the “Data folder” button at the bottom of the sidebar.

~/Library/Application Support/
  LED Event Manager/
    led-event-manager.json
    led-event-manager.backup.json

Portable projects

You can save a single project to a file and load it on another computer. You can also duplicate it to make a variant for the next venue.

Who it's for

Built for people who put up LED walls.

LED technicians and integrators

Pixel maps, signal paths and power circuits with limit checks — before the first cabinet goes on the truss.

Media server operators and VJs

Ready pixel maps, Resolume XML and NDI output, so you can load content before the wall even lights up.

Producers and technical managers

Dashboard, pack list and PDF report in one place — for quotes, riders and crew briefings.

LED rental companies

Custom modules with power and resolution, saved device templates and quick project variants by duplicating.

7
modules working on the same data
15
device types in the diagram library
20
processor outputs supported in Signal Flow
0
accounts, clouds and logins — you just launch it
FAQ

Frequently asked questions.

Do I need the internet or an account?

No. The app works fully offline: there's no login, no accounts and no cloud sync. Projects are saved locally, in a file on your disk.

Which systems does it run on?

Currently a macOS version (Apple Silicon) is available. A Windows version will come in the future.

How do I position a screen in the 3D view?

You select a screen and grab its handle: the X, Y and Z arrows move it along one axis, the square moves it across the floor, and the orange ring rotates it around the vertical axis (in 15° steps with Shift). The position rounds to 10 mm, and a plain click moves nothing.

You can enter the same values in the screen panel: X, Y, Z in millimeters plus pitch, yaw and roll in degrees. The Reset button returns to the 2D layout.

Do I need NDI to use the app?

Only for NDI output. This feature uses the NDI Runtime, installed together with NDI Tools, and detects it on its own. If it isn't there, the app tells you what it is looking for; all the other modules work without it.

How do I add LED cabinets to a project?

In the Add screen dialog you define a cabinet: a name, the size in millimeters, the resolution in pixels and the power per piece. You can save it so it comes back for further screens. The power is useful in Power Flow, because that's where watts are counted.

Can I design a trade-fair booth with an LED ceiling and floor?

Yes. Every screen has a position in millimeters (X, Y, Z) and a rotation on three axes, so it can hang from the ceiling, lie on the floor or stand at an angle. The MotoExpo and TechFair projects on this page are examples. You position them with the handle on screen or by typing the position in the panel.

Where are my projects saved?

In a JSON file in the app's data folder (on macOS: ~/Library/Application Support/LED Event Manager/), with a backup of the previous version. You open the folder from the File → Show Data Folder menu or with the “Data folder” button at the bottom of the sidebar. You can also save a single project to a separate file and load it on another computer.

Get started

Design your next LED wall faster.

Install the app, open a project and see what your stage looks like in 3D before you head to the venue.

  • macOS · Apple Silicon
  • Version 1.0.0
  • No account or telemetry in the app

Want the app or a quote? Write to us.

info@led-manager.com